mapping

The time to make a plan is now

emergency-response21-223491Reality: Emergencies happen

Contemplating worst case scenarios and one’s potential responses is clearly a source of amusement for many. But to public servants who shoulder the responsibility of providing critical services to citizens in a time of crisis, considering the ramifications of different types of emergencies can be a very sobering thing indeed.

Earthquakes, hazardous chemicals, disrupted transportation infrastructure, criminal sabotage, housebound staff, islands of isolation…little creativity is required to conjure visions of circumstances within which maintaining basic services and providing vital support to citizens can abruptly change from daily and routine to supremely challenging.

Preparation is key.

Preparing to Prepare

washWe are working with Washington County, Oregon to help assess their needs and optimize their resources so they are better equipped to plan responses to different types of emergencies. The project involves a broad group of stakeholders that extends across many County departments.

We’ll start by examining individual and shared needs and concerns to help define the ideal type of information needed in a variety of emergencies. Next, we’ll explore the best way to provide that information so that stakeholders may individually and collectively improve their planning and preparation for responding in times of crisis.

After we’ve spoken to shareholders, defined the necessary information, and explored options for sharing that information when the resources we take for granted on a daily basis have been compromised, we’ll provide recommended solutions and help the County in implementing them.

Common Functions

The necessary information needed by this particular set of shareholders will certainly be unique, but in our experience with helping organizations prepare for emergencies, we’ve found that the solutions start with many commonalities:

  • They need to address geographic, place-based questions.
  • They must cross functional, operational, and jurisdictional boundaries. Disasters tend not to honor human boundaries!
  • They must be multi-disciplinary.
  • A planning and training module is extremely important. The best way provide a truly coordinated response is continual training. Part of good planning involves assuring that emergency responders have “muscle memory” when it comes to their tools so there are no questions about how to use them.

Preparation Saves Lives!

No one wants a disaster to occur, but when they do happen, preparation can save lives. A solid plan, and useful tools can be the difference between a smooth recovery and a long haul.

If it’s time to assess your emergency preparedness and planning resources, feel free to drop us a line.

Drag and Drop GIS

I dragged and dropped this image onto the blog postDrag and drop isn’t really anything new. The ability to drag a file across network has been with us for quite some time. Photoshop users are pretty comfortable with dragging elements from one layer to another and anyone using Word has likely done a little dragging and dropping. It’s practically ubiquitous at this point.
Except for within the world of GIS.

When was the last time that you dragged a shapefile onto a map? Never, you say?

Well, my (GIS nerd) friends, prepare for your world to be rocked!

Drag and Drop in Javascript is as easy as…

While developing the ESII Tool, it became clear that our clients would really love the ability to quickly swap out basemaps and possibly use some specialized georeferenced imagery, such as GeoTiffs and shapefiles. The ESII tool has two components; the web-based Project Workspace, where projects are planned, and the iPad app, where data collection is implemented. We wanted to be able to bring the drag and drop function to the Project Workspace, written in Javascript.

The exposure of the FileReader API in HTML5, now well supported by the Big 3 browsers, has allowed for fantastic ports of GIS format converters, including binary format converters. The ESRI Shapefile, and the GeoTiff are perhaps the 2 most staple formats of the GIS world representing vector and raster respectively. To be able to drop these data formats into a web map is indeed a miraculous feat for those of us who have whiled many an hour in the bad old days trying to bring these up on a monochrome CRT. Both the Shapefile and GeoTiff JavaScript libraries were obtained via GitHub.

At the heart of these conversions is support for Typed Arrays in JavaScript or rather, the ability to obtain ‘views’ into binary data. With the shapefile converter for example, the zipped file must first be decompressed (using the JsZip library), the PRJ file is then parsed and a proj4.js conversion function is created, then the DBF and SHP files are parsed (including the important differences in Endianness and any necessary projection functions) and converted to GeoJSON, a human-readable format. From there it’s just tossing the GeoJSON at your mapping API of choice and symbolizing as you like.

Drag and Drop your own file

We’ve provided a sample below for you to try your own drag and drop GIS. The widget will support up to 15 megabytes of geogoodness; the GeoTiff needs to be uncompressed and stored in WGS84, while the shapefile can either be zipped or, simply drop the .shp, .prj, and .dbf files on the map and see what happens!

If you don’t have a shapefile handy, you can download one from the RLIS Discovery site.

Set up an account with ESII and do more Drag and Drop GIS

Now that you’ve read about what we did – and dipped your toes into the water –  it’s time to try it for yourself. To get started, go to esiitool.com and sign up for an account. Once you’ve got an account set up, you’ll want to create a Site and a Data Collection Effort in a location that you have specialized georeferenced imagery. It is here, during this stage, that you can drag and drop a geotiff, or shape file onto your map and it will act as a layer that you can turn on or off.

Try it out for yourself.

New PSU Campus Map

Headed to Portland State University in Portland, Oregon this fall, but don’t know your way around campus? Or, headed back to PSU and looking for a better way to find what you’re looking for on campus? Don’t worry. You’re covered!
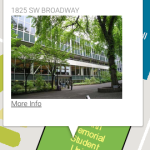
The Gartrell Group recently finished work on, and released, Contextual pop-upVersion 1 of the PSU Campus Map. It’s a responsively designed site, so it can be used on your mobile device as well as your laptop or desktop computer.

Everything you need

When you open the map, by default, every building on campus is highlightable. Click on the building to find out the name, see a picture and have the option to dig deeper.

The powerful search engine uses autocomplete to help you quickly find what you are looking for, from specific rooms to departments, or even administrative offices.

Themed Maps

Screen Shot 2015-08-19 at 11.52.26 AMIn addition to the search function, there are theme maps that help you quickly find what you are looking for. Since transportation to and from school is pretty important, the Transit and Parking maps are at the
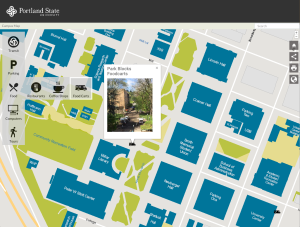
top. Included are all of the MAX (light rail), Streetcar and Bus stops. Click the icon on the map to see links to arrival times.

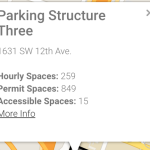
If you need to park on campus, there are two options within the Parking map; Hourly/Daily and Permit. When you turn either, or both (you can turn on every theme map, if you want, but the map may get a bit crowded!) parking maps on, the lots on the map are highlighted. Click on one to get more information about it.

Food is also a pretty important thing to a hard-working college student. The map has three food-related layers; restaurants, coffee shops, and food carts (because, Screen Shot 2015-08-10 at 11.13.10 AMPortland).

While most people on campus have a laptop these days, not everyone has a printer in their dorm room or apartment. The Computers layer of the map shows the location of all of the campus computer labs, where, probably of more importance than the actual computers, there are printers located for student use.

Also included are a variety of campus tours. The PSU Campus tour map highlights important features on Screen Shot 2015-08-19 at 11.32.14 AMcampus, from the recreation center to the campus bookstore. The Art tour map is a guide to PSU’s large collection of sculptures, paintings and other art installations. From LEED buildings to bioswales, a cycle track to a field made from recycled sneakers, the Sustainability tour puts PSU’s leadership in urban sustainability on the map. Literally.

Share it!

What modern app would be complete without a share option? With the PSU Campus Map, the share option is always present. It’s easy to quickly grab the URL of the map view that you are looking at and email it, Facebook it, Twitter it, Yik Yak it – the list is long, the point is simple; you can share whatever you are looking at on the map with whomever you’d like, however you’d like.

Tech details

PSU needed a map that was easy to maintain and update and ideally did not require a specialized map server to deliver their map data. After analyzing PSU’s needs, The Gartrell Group designed the solution around an AngularJS-based web application using the Google Maps API. The colored campus overlay is stored in a geographic tile cache of images on an Apache Web Server while the data for the buildings, parking lots and transportation information are stored in geoJSON files on the server.

GeoJSON is a format for encoding geographic data within JSON formatted text files.  Because of the tile cache and geoJSON files, no specialized map server is required and any web server can be used for this solution. When PSU wants to update the map, they simply replace the tile cache or the geoJSON files. PSU generates the tile cache and geoJSON files using standard GIS tools.