Big Ideas

Vector Tiles for All!!

What are vector tiles?

Vector tiles are packets of geographic data, packaged into pre-defined roughly-square shaped “tiles” for transfer over the web. As with the widely used raster tiled web maps, map data is requested by a client as a set of “tiles” corresponding to square areas of land of a pre-defined size and location. Unlike raster tiled web maps, however, the server returns vector map data, which has been clipped to the boundaries of each tile, instead of a pre-rendered map image.

Why should one use vector tiles?

Compared to an un-tiled vector map, the data transfer is reduced because only data within the current view, and at the current extent needs to be transferred. Vector tiles are also faster to download than a tiled raster map, as vector data is typically much smaller than a rendered bitmap.

Additionally, with a tool such as Mapbox GL JS, styling can be applied later in the process, or even in the browser itself, allowing much greater flexibility in how data is presented. It is also easy to provide interactivity with map features, as their vector representation already exists within the client. 
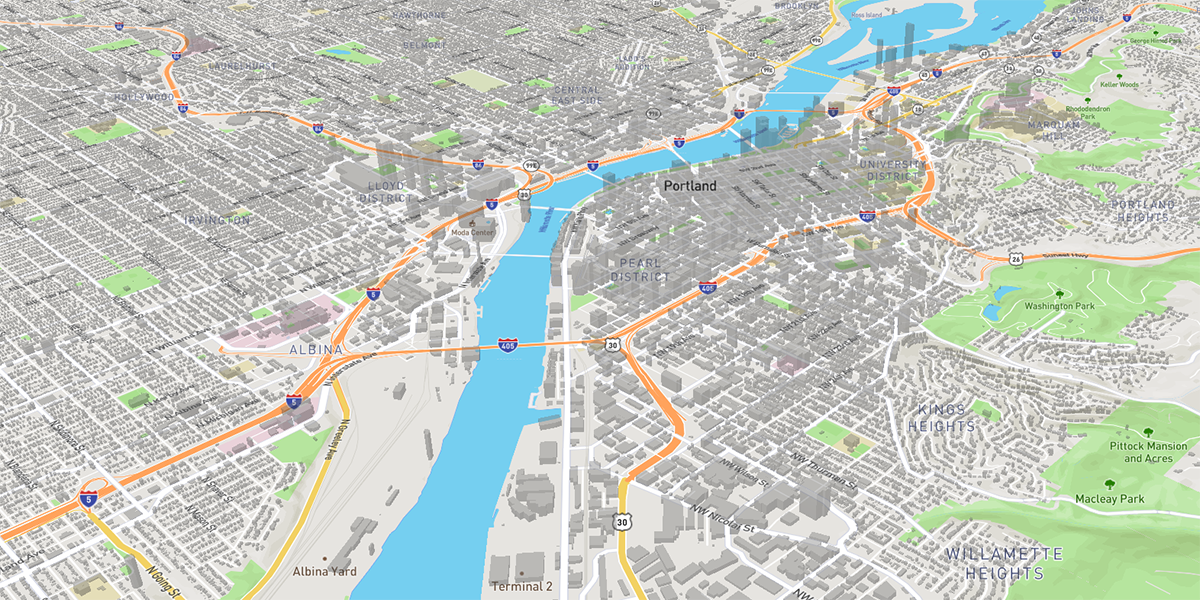
This is an example of a building footprint layer (from Oregon Metro) presented as vector tiles using Mapbox GL JS. The tiles are served quickly to the client, and using the Mapbox GL JS the data can be rendered in a variety ways. Here it’s being shown in 3D.

How do we use them?

Our crack team of developers has deployed a vector tile server that allows us to serve mbtiles raster files, mbtiles vector files, and ESRI bundled cache files. At this point, we are using it for most of our client-hosted applications. It’s a faster solution than anything we’ve used in the past, and it allows our dev team to create tools and functions in our JS-based Map Viewer that take advantage of the flexibility of the tiles.

We like to share

We submitted the code to GitHub for anyone to deploy.  At the core of the MBTiles server are dual instances of a node.js script that has been customized and offered to the public. Everything windows users need to get this up and running is included in the repository. The mbtiles server, the .NET reverse proxy, and the service creation scripts.

Once you’ve installed the MBTiles server, starting a web service is as simple as copying either raster or vector mbtiles files into the mbtiles cache directory. Setting up an ESRI bundled cache service is just as simple; copy the arcgis server cache directory to your mbtiles cache directory and you’re done!

Let us know what you think, or if you have any questions!

Links

The Gartrell Group MBTiles server 

Script to install windows services

The script that we forked in order to create the windows services script


Drag and Drop GIS

I dragged and dropped this image onto the blog postDrag and drop isn’t really anything new. The ability to drag a file across network has been with us for quite some time. Photoshop users are pretty comfortable with dragging elements from one layer to another and anyone using Word has likely done a little dragging and dropping. It’s practically ubiquitous at this point.
Except for within the world of GIS.

When was the last time that you dragged a shapefile onto a map? Never, you say?

Well, my (GIS nerd) friends, prepare for your world to be rocked!

Drag and Drop in Javascript is as easy as…

While developing the ESII Tool, it became clear that our clients would really love the ability to quickly swap out basemaps and possibly use some specialized georeferenced imagery, such as GeoTiffs and shapefiles. The ESII tool has two components; the web-based Project Workspace, where projects are planned, and the iPad app, where data collection is implemented. We wanted to be able to bring the drag and drop function to the Project Workspace, written in Javascript.

The exposure of the FileReader API in HTML5, now well supported by the Big 3 browsers, has allowed for fantastic ports of GIS format converters, including binary format converters. The ESRI Shapefile, and the GeoTiff are perhaps the 2 most staple formats of the GIS world representing vector and raster respectively. To be able to drop these data formats into a web map is indeed a miraculous feat for those of us who have whiled many an hour in the bad old days trying to bring these up on a monochrome CRT. Both the Shapefile and GeoTiff JavaScript libraries were obtained via GitHub.

At the heart of these conversions is support for Typed Arrays in JavaScript or rather, the ability to obtain ‘views’ into binary data. With the shapefile converter for example, the zipped file must first be decompressed (using the JsZip library), the PRJ file is then parsed and a proj4.js conversion function is created, then the DBF and SHP files are parsed (including the important differences in Endianness and any necessary projection functions) and converted to GeoJSON, a human-readable format. From there it’s just tossing the GeoJSON at your mapping API of choice and symbolizing as you like.

Drag and Drop your own file

We’ve provided a sample below for you to try your own drag and drop GIS. The widget will support up to 15 megabytes of geogoodness; the GeoTiff needs to be uncompressed and stored in WGS84, while the shapefile can either be zipped or, simply drop the .shp, .prj, and .dbf files on the map and see what happens!

If you don’t have a shapefile handy, you can download one from the RLIS Discovery site.

Set up an account with ESII and do more Drag and Drop GIS

Now that you’ve read about what we did – and dipped your toes into the water –  it’s time to try it for yourself. To get started, go to esiitool.com and sign up for an account. Once you’ve got an account set up, you’ll want to create a Site and a Data Collection Effort in a location that you have specialized georeferenced imagery. It is here, during this stage, that you can drag and drop a geotiff, or shape file onto your map and it will act as a layer that you can turn on or off.

Try it out for yourself.

What does The Nature Conservancy have in common with Dow Chemical Company?

Surprisingly, more than one might imagine. For one thing, they are both working with The Gartrell Group… and on the same project!
As D.T. Max explores in the New Yorker article “Green is Good,” The Nature Conservancy (TNC) is in the process of adopting a new approach to nudge commercial interests to adopt greener management and operational strategies.

We are very excited to participate in this historic project and to build the software tools described in Max’s article. The tablet-based solution will offer an array of cool capabilities Dow staff may use for identifying, delineating, and monitoring the natural resource “assets” and ecosystem services present on their properties. They will also be able to perform modeling of alternative land uses to assess the impacts of different management strategies.

Designing and developing this solution is bringing together many of the tools and areas of expertise that have been called for in our recent projects.

Mobile

mobileGISThe solution will primarily be used by people working in the field, so it will be aimed at mobile users. The first iteration of the tool will be built on iOS for use on iPads.

Disconnected Editing

Field work usually involves being in remote areas with little-to-no connectivity. This solution, like others that we’ve worked on recently, will allow users to make edits while in the field. Those edits will be loaded onto the cloud as soon as the device is connected to either a cell connection or Wi-Fi.

Cloud Hosting

The data will live in a secure, hosted environment that will ensure that everyone is always working with the mot recent information.

Web Management Tools

Like many of our recent projects that involve mobile users going out into the field, this solution will include a web-based management tool. This tool allows managers to create projects for field workers. These projects include maps and data that are then downloaded to the field worker’s iPad so that they have the most recent data to work with.

Processing Models

A key element to this project is to quantify the impact of different resource management strategies on the ecosystems within which Dow properties are involved. We will be working closely with stakeholders from both Dow and TNC as well as scientists from Ecometrix Solutions Group to develop these tools in the form of data processing models that measure the impacts of different land uses and activities.

This is an exciting collaboration - one that we’d have had a hard time believing could exist twenty years ago. We feel that it is part of a significant shift in the economics of environmentalism and capitalism, one focused on bringing more green to the bottom line.